Life and Times of Residual Vectors for PSD Analysis
Why
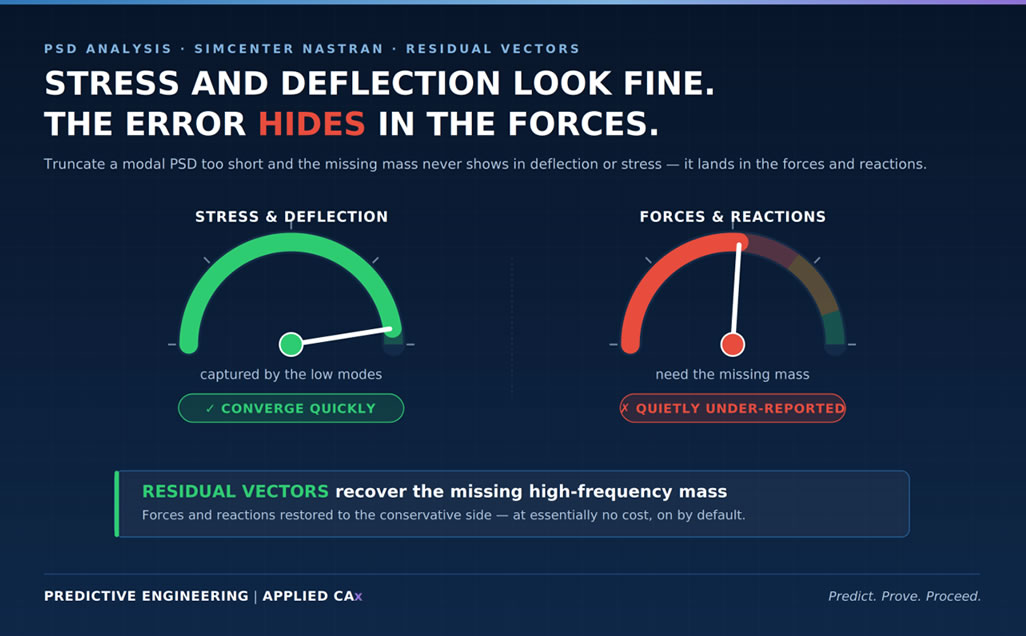
To provide a bit more confidence that your PSD analysis reflects reality
What:
This is about getting high-quality PSD results where the loading is by a base acceleration spectrum. Of course, the techniques discussed in this note can be applied to any type of PSD analysis and also to SRSS (e.g., seismic) analyses where Residual Vectors can be employed.
File .dat: Technical Note - Life and Times of Residual Vectors - Simcenter Nastran Deck
PDF Download